Here is a link to the paper, written by Sophia Boutilier, Ali Jadidzadeh, Elena Esina, Lana Wells and Ron Kneebone (2017): https://journalhosting.ucalgary.ca/index.php/sppp/article/view/42627
I reached out to a representative of the University of Calgary’s School of Public Policy on January 24, 2021 and so far, haven’t gotten a response from the authors. What follows is a summary of the paper and an explanation of its many issues:
Several bold claims in the summary:
- Stampeder’s games vs Eskimos increases domestic violence calls by 40%, but no significant effects for hockey games.
- Towards the end of Stampede domestic violence calls increase by 15%
- When the price of West Texas Intermediate decreases by $10US it results in an additional 0.5 daily calls.
- Significant spikes in domestic violence calls for certain holidays.
- Domestic violence calls increase on weekends and summer months.
The calls dataset goes from 2011-2014 inclusive which is 1,461 days, number of calls is summed at a daily granularity.
Literature Review:
- Holiday effect: Only New Years is consistently a significant day in the literature.
- Strong effect when there are sports events, but the studies are either small (n=18), geographically restricted (LA county), or have inconsistent findings (significant effect for hockey and football but not basketball or baseball)
- Alcohol was present in 61% of accused domestic offenders and 28% of victims but the authors of this paper mention that it is unclear which way the causality runs.
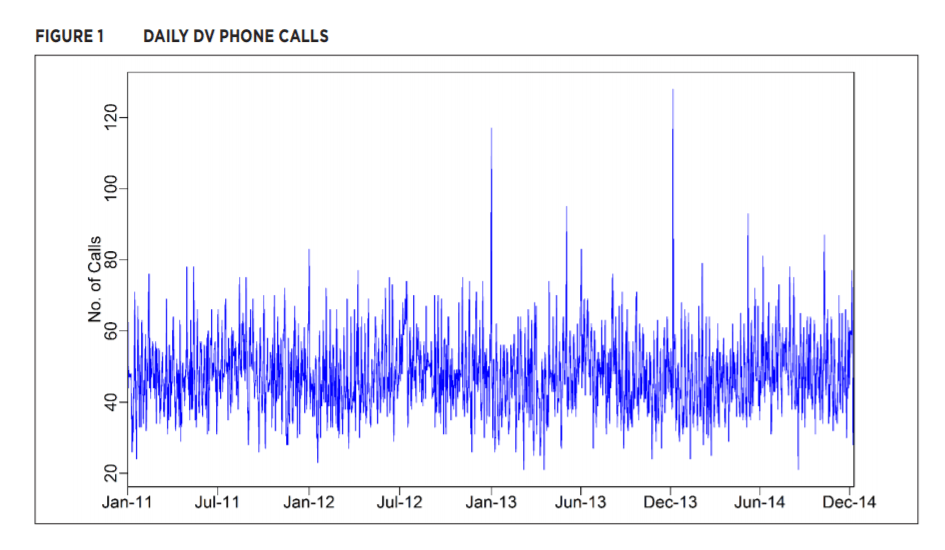
Figure 1 shows a plot of the times series and in the footnote: “These data exhibit what statisticians identify as stationary process. This property gives us confidence our analysis will avoid identify spurious correlations.” This is not what stationarity implies; the only thing that a test for stationarity will tell you is whether the mean and variance of time series is constant across the sample. An example that would violate stationarity, if there was significant in-migration to Calgary the increase in population might cause a trend that would increase the mean throughout the sample. If the sample wasn’t stationary there are other statistical techniques that could be brought to bear but finding stationarity does not guarantee no spurious correlations. (Stationarity further explained in footnote 55)
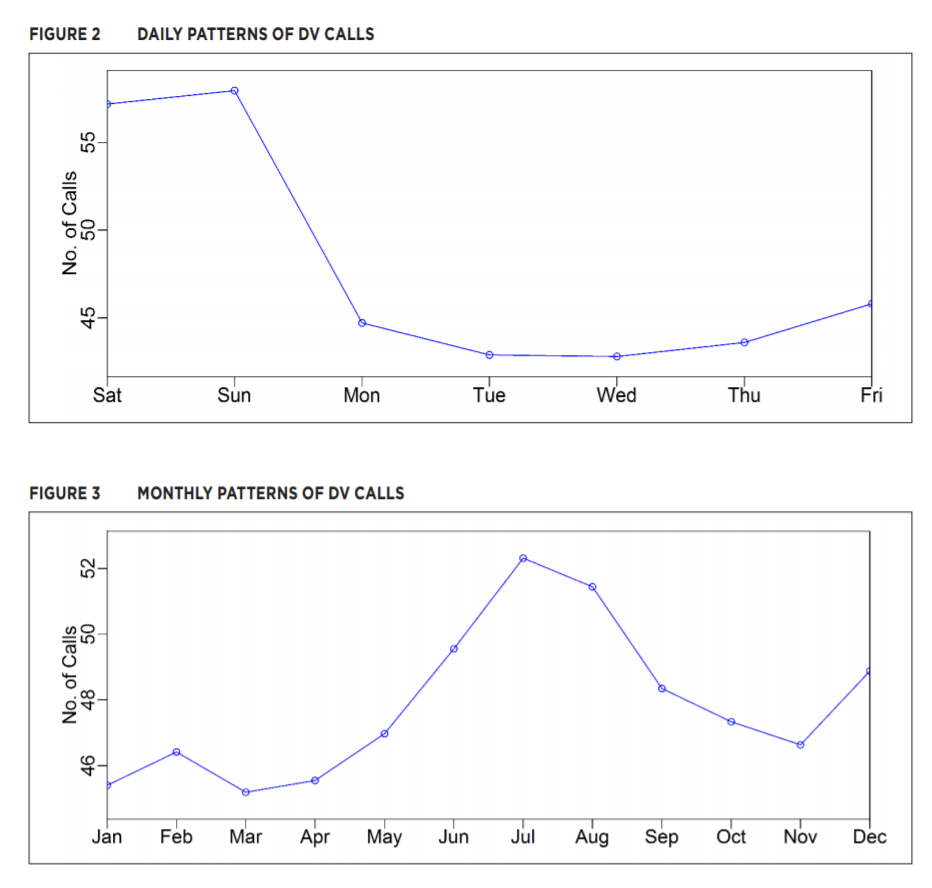
Figure 2 & 3 show average calls by the day of the week and average calls by month, respectively. Both figures show obvious patterns, more calls on weekends and summer months. The authors note these patterns, write that neither pattern is statistically significant and then don’t discuss this further. Just because a variable is not statistically significant, that does not mean it can be excluded from the model, this introduces omitted variable bias. For example, when looking at sporting events it is essential that model control for whether the event is also on a weekend. By not including a control variable that covers weekends, it makes it more likely that the model will find that sporting events increase domestic violence in a statistically significant amount – this statistical significance would disappear if weekends were controlled for.
Ideally, it would be possible to look at the data behind this paper and try to replicate some of the findings. I have searched a number of place, for example: https://data.calgary.ca/browse?q=domestic%20violence&sortBy=relevance – Domestic Violence calls statistics aren’t publicly available as far as I can tell. It is understandable that this data may be to granular for public release but that only further obliges the authors to be upfront about the analytical techniques driving their conclusions.
There is no explicit discussion of why there should be more than one model in this paper. Generally, in econometric papers, when there are multiple models, each model builds on the last one and each extension has some theoretical reason. Here again we run into omitted variable bias in each of the models, the reader is left to speculate that if all variables were included in a single model then no variable would reach a reasonable level of statistical significance.
Model 1:
- The paper discusses using precipitation as an explanatory variable, but it does not show up in model 1 which models the weather.
- The paper claims that decreases in the price of oil, specifically WTI, increases the number of domestic violence calls. This is similar to a recent paper titled “When The Market Drives You Crazy: Stock market returns and fatal car accidents” which claimed that decreases in stock prices caused more car accidents. It is difficult to imagine that many people are aware of daily stock market performance, no less that the impact is great enough to make them drive more recklessly. The same could be said here, it is difficult to make the case that people in Calgary, an oil and gas focused economy are aware enough of a leading indicator like WTI prices for it to change their behavior today. In the motivation for including this variable seems to be that economic uncertainty is a stressor, which is reasonable, but wouldn’t the unemployment rate or EI applications be a better measure (especially given the larger percentage of Calgary that is not even indirectly attached to the oil and gas sector)? The reader is left wondering if WTI price was chosen because it is at a convenient daily frequency whereas other more meaningful economic indicators are released monthly. It is also worth thinking about the base rate, what percentage of individuals are aware of the daily WTI price? If the base rate is 1%, then the true effect of WTI on domestic violence calls is 100x higher than estimated. [Finally, why not use the price of Western Canadian Select rather than West Texas Intermediate if this paper is focused on Calgary]
- A significant variable which isn’t heavily discussed is the variable capturing “the issuance of social assistance cheques, [which] is found to be associated with an extra 1.9 DV calls per day during the five days following. There is no discussion or control for other factors at the end or start of a month that could act as stressors. Think for example about the effect of weekend on domestic violence calls, if there are more weekends that happen to occur within the cheque period it would bias upward the estimated effect of social insurance cheques. In fact, if you compare the number of weekend in these dates during the study period (2011-2014) you will find that weekend occur 4.7% more often than normal (comparing to 2015-2050).
Model 2:
- There is a variable called “Data Source (DSC)”, I assume that this is an artifact of the analysis process. Perhaps there were originally four different spreadsheets, each one representing a different year, when all the years were collected this column was to establish providence but should not have been included in the regression – including this variable will potentially change all of the model estimates.
- Holidays are modelled with a pre- and a post-holiday dummy variable, it is unclear why a single holiday event would be split into three different days each with their own estimate, furthermore since this is time series data – why would not this relationship be specifically modeled with lag variables? Looking at this model it appears likely that if the full three days were grouped together then few holidays estimates would reach statistical significance.
- Canada Day does not have a dummy variable pre- and post-holiday, there is no explanation why it doesn’t follow the pattern of the rest of this model.
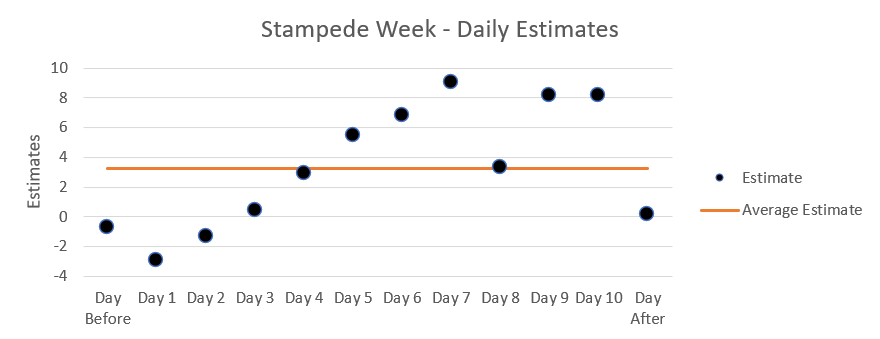
- The paper highlights that the end of the Calgary Stampede marks an increase in domestic violence but the results in the model are significantly more mixed. What theory would support the finding that the first weekend of Stampede tends to decrease domestic violence? The graph below also makes clear the issue of not grouping an event together into a single dummy variable. While there are some days that show a significant increase in domestic violence but on average (shown in orange) the daily effect does not reach statistical significance.
Model 3:
- The main finding of this model was that Stampeder’s games versus the Edmonton Eskimos increased domestic violence by a statistically significant amount. But in Model 2 it was found that Labour Day had a significant effect, given that biggest game of the year is the Labour Day Classic between the Stampeders and Eskimos, is it possible that this is drive the results here. This again highlights the need to include both variables in the model, as presented we cannot tell whether Stampeder’s games against the Eskimos increase domestic violence or if the date of the game being on Labour Day is the true cause.
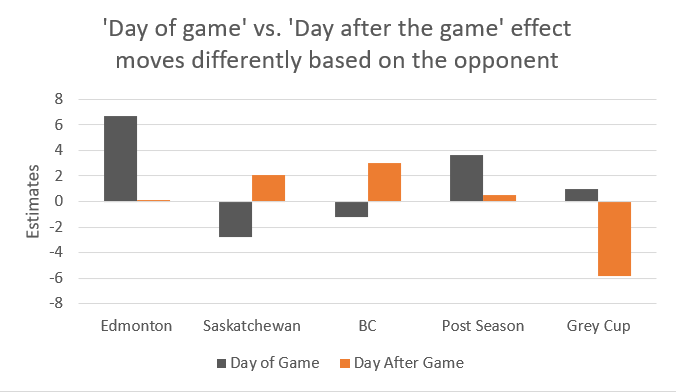
- Taking this model as a whole, it doesn’t seem compelling that sports drive an increase in domestic violence calls because very few variables reach significance, and many games seem to decrease domestic violence calls. Furthermore, some of the variables represent extremely rare events, such as “Grey Cup.post*Stamps.post” which I understand to be an interaction variable that means the day after the Stampeders participated in the Grey Cup. For context this, happened twice in the sample, 2 out of 1,461 days. In addition, the pattern between the increase or decrease in calls being on game versus the day after the game is inconsistent:
Conclusion: I understand that the paper was peer-reviewed but I believe the errors are sufficient that the econometrics no longer support the recommendations made in this paper.
